
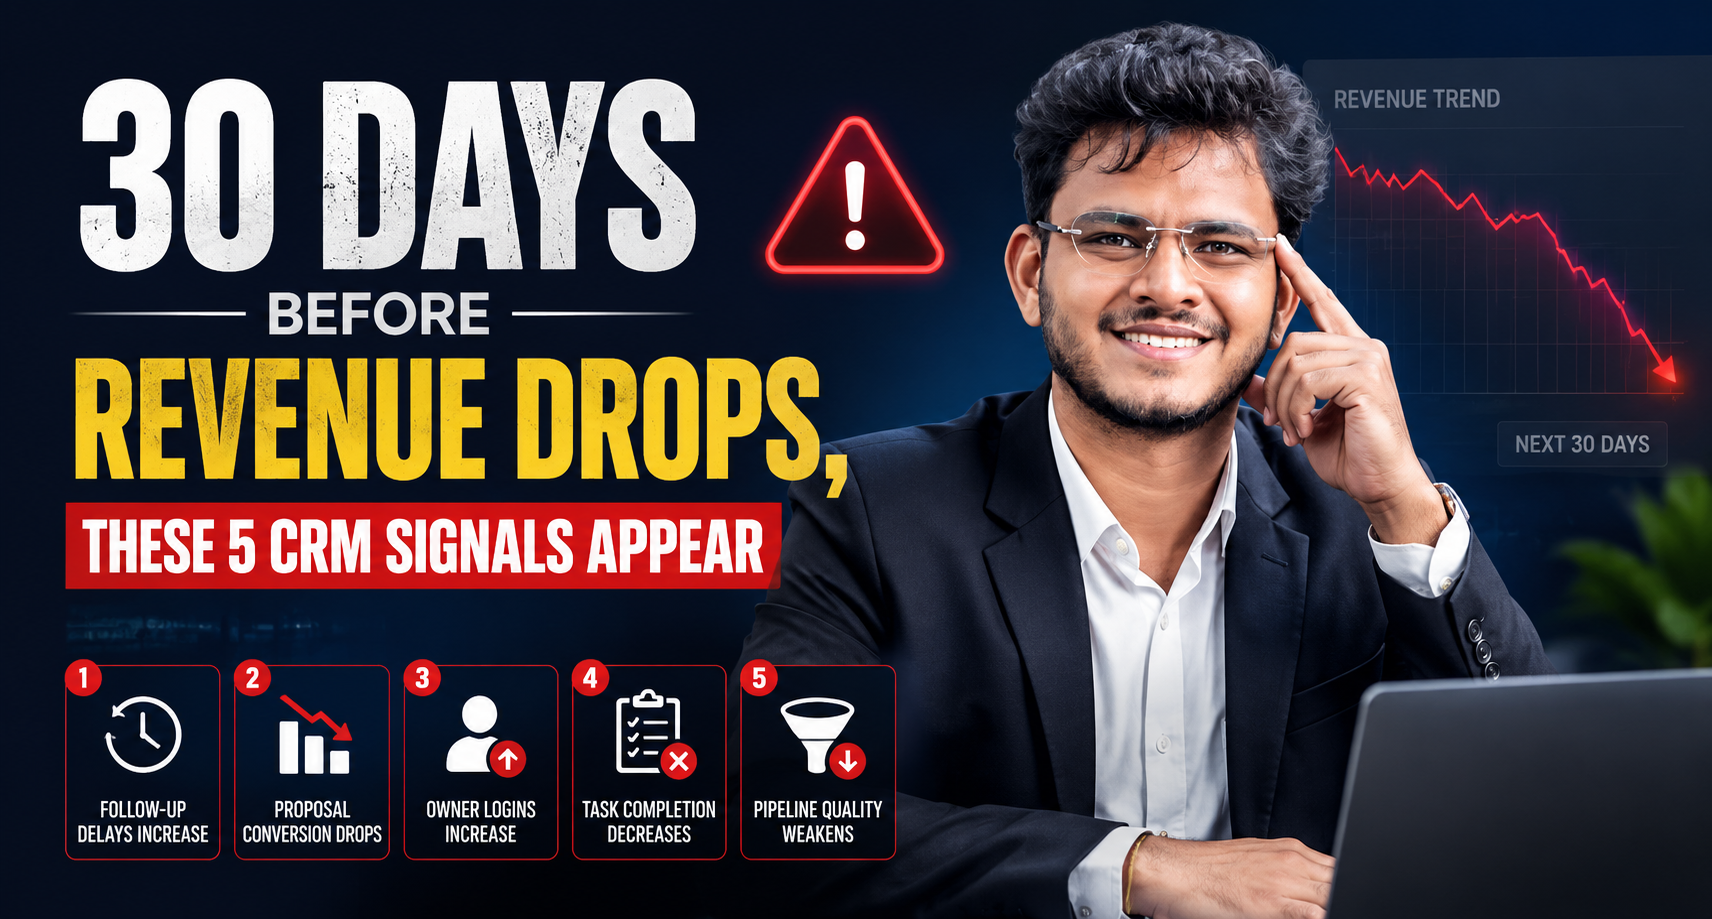
 In most businesses, declining sales are preceded by small operational changes that often go unnoticed. Your CRM captures these signals long before they appear in financial reports.
If you know where to look, you can identify problems weeks before they affect your revenue.
1. Follow-up Delays Start Increasing
Sales opportunities depend on speed.
When the average follow-up time begins to increase from a few hours to a day or two lead engagement starts declining. Prospects lose interest or move to competitors who respond faster.
Track:
- Average first response time
- Average follow-up delay
- Overdue follow-up count
Warning Sign
If follow-up delays increase by more than 20–30% over a month, expect lower conversion rates in the coming weeks.
2. Proposal Conversion Begins Falling
The number of proposals may remain the same, but fewer customers accept them.
This usually indicates:
- Increased competition
- Poor pricing strategy
- Weak sales conversations
- Delayed proposal delivery
Track:
- Proposal-to-order conversion %
- Proposal aging
- Average time from enquiry to quotation
Warning Sign
A steady decline in proposal acceptance often predicts lower revenue before sales reports reveal the problem.
3. Owner Logins Suddenly Increase
One surprising CRM signal is management behavior.
When business performance becomes uncertain, owners tend to:
- Check dashboards multiple times a day
- Review every deal personally
- Monitor employee activity closely
While increased involvement isn’t bad, a sudden spike in owner logins often reflects concern about pipeline health.
Track:
- Daily owner login frequency
- Dashboard visits
- Manual deal updates
Insight
Micromanagement is often a symptom not the cause of declining sales performance.
4. Staff Task Completion Drops
Sales processes depend on consistency.
When employees stop completing CRM tasks:
- Follow-ups are missed
- Meetings aren’t recorded
- Customer information becomes outdated
Eventually, opportunities begin slipping through the cracks.
Track:
- Task completion rate
- Overdue tasks
- Activities completed per salesperson
Warning Sign
A falling task completion rate usually appears several weeks before revenue declines.
5. Pipeline Quality Starts Weakening
Your pipeline may still look healthy because it contains many opportunities.
But the quality changes:
- More stale leads
- Fewer qualified prospects
- Longer sales cycles
- Deals remain in the same stage
Track:
- Average deal age
- Stage-wise conversion
- Pipeline velocity
- Win rate
Build an Early Warning Dashboard
Instead of waiting for monthly revenue reports, monitor these leading indicators every week:
| CRM Signal | Early Warning |
|---|---|
| Follow-up delay | Increasing |
| Proposal conversion | Declining |
| Owner logins | Increasing sharply |
| Task completion | Falling |
| Pipeline velocity | Slowing |
Revenue is a lagging indicator.
CRM activity is a leading indicator.
Businesses that monitor these signals can take corrective action before revenue is affected.
Conclusion
The best-performing companies don’t wait for declining sales to investigate problems. They use CRM data to detect patterns early, improve execution, and protect future revenue.
Leave a Reply